Data Tracking & Intelligence
Turn raw data into
real decisions.
We connect your tools, track every KPI, build live dashboards, and integrate your entire data ecosystem, so your team always knows exactly what's happening.
We handle the technical side so you can focus on running your business and making smarter decisions.
We set up clean, reliable tracking so you know exactly where every lead, sale, and conversion comes from, across every channel you run.
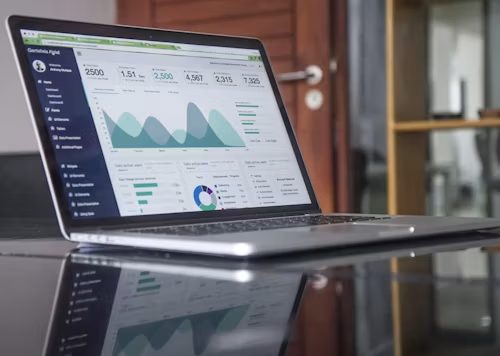
Custom dashboards that show your most important numbers in one place, clear data, updated in real time, with no spreadsheets required.
Professional Power BI reports that connect all your data sources and give your team the visibility they need to move fast and stay aligned.
We connect your CRM, ad platforms, website, and any other tools into a single data ecosystem, so information flows automatically.
Select a key metric to see its trend, monthly breakdown, and key insights. This is what your reporting looks like when everything is connected.
We build custom dashboards in Power BI, Looker Studio, or bespoke solutions that pull from all your data sources and update in real time.
High-level KPI views, revenue, growth, and market trends at a glance, designed for fast decision-making.
Real-time operational data, inventory, pipeline, and campaign health all in one view.
All your platforms, ads, CRM, website, finance, pulled into one clean, unified view.
We integrate with all major platforms so your data flows automatically, no manual exports, no gaps.
"I used to just guess where my leads were coming from, now I actually know. The data tools helped me figure out which ads were getting real traction. I started getting better leads and closing deals in the first few weeks."
"Implementing Power BI for our pharmaceutical client was a game-changer. Our custom dashboards gave real-time visibility into inventory, sales, and compliance. The impact was immediate, faster insights and more confident decisions."
"Data Drive is one of those teams you remember working with. Calm, thoughtful, asks the right questions, and actually listens to the answers. If you get the chance to bring them onto a project, take it."
Book a free consultation and we'll audit your current tracking setup and show you exactly what's possible.
Tell us about your business and we'll get back to you within one business day to schedule a free call.